|
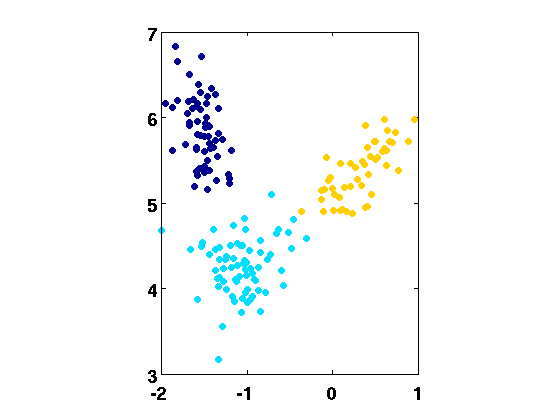
Fig. 1 shows the resulting 2-D feature plot taking all the 178 samples. For plotting the Wine feature space, the function plot_wine.m is posted. Note that the function is specifically tailored to the Wine data. Also note that it is assumed that a file wine.mat resides in the same directory as plot_wine.m. This file should contain a variable Data in the form of 178 x 14 matrix. The last column of this matrix contains class label indicators (integers), e.g. {0, 1, 2}. Type help plot_wine or take a look at the source code for further information on this function.
For example, running [T et] = plot_wine(2,1); from MATLABTMcommand prompt returns the following:
The input arguments represent:
| Dataset | m | 1 | 3 | 5 | 13 (full) |
| AIDA(L) | 91.57 |
|
98.88 | 98.88 | |
| ACC(L) | 89.89 | 98.88 | 98.31 | 98.88 | |
| MLT(L) | 82.58 | 97.75 | - | 98.88 | |
| Tubbs(L) | 67.41 | 74.72 | 91.57 | 98.88 | |
| LDA(L) | 91.01 | 98.88 | - | 98.88 | |
| Wine | LPP(L) | 92.13 | 98.31 | 98.31 | 98.88 |
| AIDA(Q) | 92.13 | 99.44 |
|
99.44 | |
| ACC(Q) | 91.01 | 99.44 | 99.44 | 99.44 | |
| MLT(Q) | 85.95 | 99.44 | - | 99.44 | |
| Tubbs(Q) | 70.22 | 76.4 | 97.19 | 99.44 | |
| LDA(Q) | 91.57 | 99.44 | - | 99.44 | |
| LPP(Q) | 92.13 | 98.31 | 99.44 | 99.44 |
The performance of AIDA criterion was tested experimentally with the Wine dataset and
compared to the performances of LDA, ACC [3], Tubbs [4],
MLT [5] and LPP [6]. The
performance was evaluated using linear and quadratic Bayesian
classifiers, with prior probabilities estimated
empirically from the data and the Gaussian approximation of the
class-conditional probability density functions. A leave-one-out cross
validation (CV) was used for performance evaluation.
The admissible subspace dimensions are
1![]() m
m![]() c - 1 for LDA,
1
c - 1 for LDA,
1![]() m
m![]()
![]() c(c - 1) for MLT [5], and
1
c(c - 1) for MLT [5], and
1![]() m
m![]() n - 1 for the AIDA,
Tubbs, LPP and ACC methods. Table 1 shows results, represented by the estimated
correct classification rates,
for various dimensions of the feature space. The boxed values represent the
best results for each classifier.
n - 1 for the AIDA,
Tubbs, LPP and ACC methods. Table 1 shows results, represented by the estimated
correct classification rates,
for various dimensions of the feature space. The boxed values represent the
best results for each classifier.